

My math skills are fading, but, I thought it would be interesting and fun(?) to look at some stats of my blogs while re-learning how to do some statistical analysis.
I am using Google Sheets, and will add to this post as I figure out more analysis I can do…..while keeping it interesting and fun.
Non-profit website & blog
Since selling my business on Dec 31, 2014, I am spending more time posting on ForCarol.org our non-profit web site.
Looking at the stats WordPress.com gives me, I decided to see if there was a correlation between the number of posts I write in a month and the visits / views for that month (or the next month, if there is a delay).
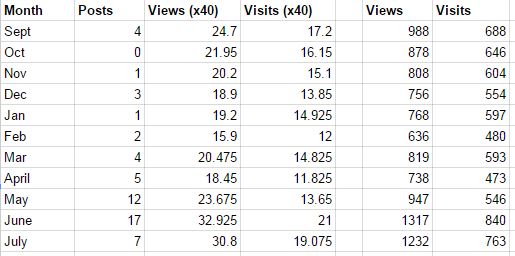
From Sept 2014 to July 2015 here are ForCarol.com’s numbers:
Here is a graph:

You can see that as the # of posts go up (blue), the views (red) and visits (yellow) appear to also go up.
Interesting…..
Reaching back in memory, I looked to see if Google Sheets could do a correlation between posts and views and posts and visits.
Remember the closer the correlation coefficient is to 1, the more perfect the correlation.
Correlation of Posts to Views: .73948
Correlation of Posts to Visits: .50532
Hmmmm, more posts lead to more views….
Stay tuned for more “Fun with Statistics”. Tip my hat to Sheldon….
More STEM / STEAM….